Prometheus学习(prometheus operator使用)
在很多的一段时间内, 业务一直都是使用单独的prometheus进行集群业务的监控,通过prometheus提供的服务发现能力, 在业务svc加入指定的annotations即可实现数据收集, 但还是会面临时常需要修改prometheus的配置文件(比如static scrape),prometheus虽然也提供了配置热加载的能力, 久而久之也烦,如果能够实现配置的动态加载, 对运维人员无感操作, 是不是就方便地多, prometheus operator即可实现.
对于平台来说, 上面跑着若干产品线,prometheus operator能够将更多的自由度移位到业务侧, 比如抓取时间,超时时间等,同时也使得平台运维同事的工作量能够解脱出来.
需要对prometheus及operator的工作机制有所了解
架构
Prometheus Operator 架构图如下:
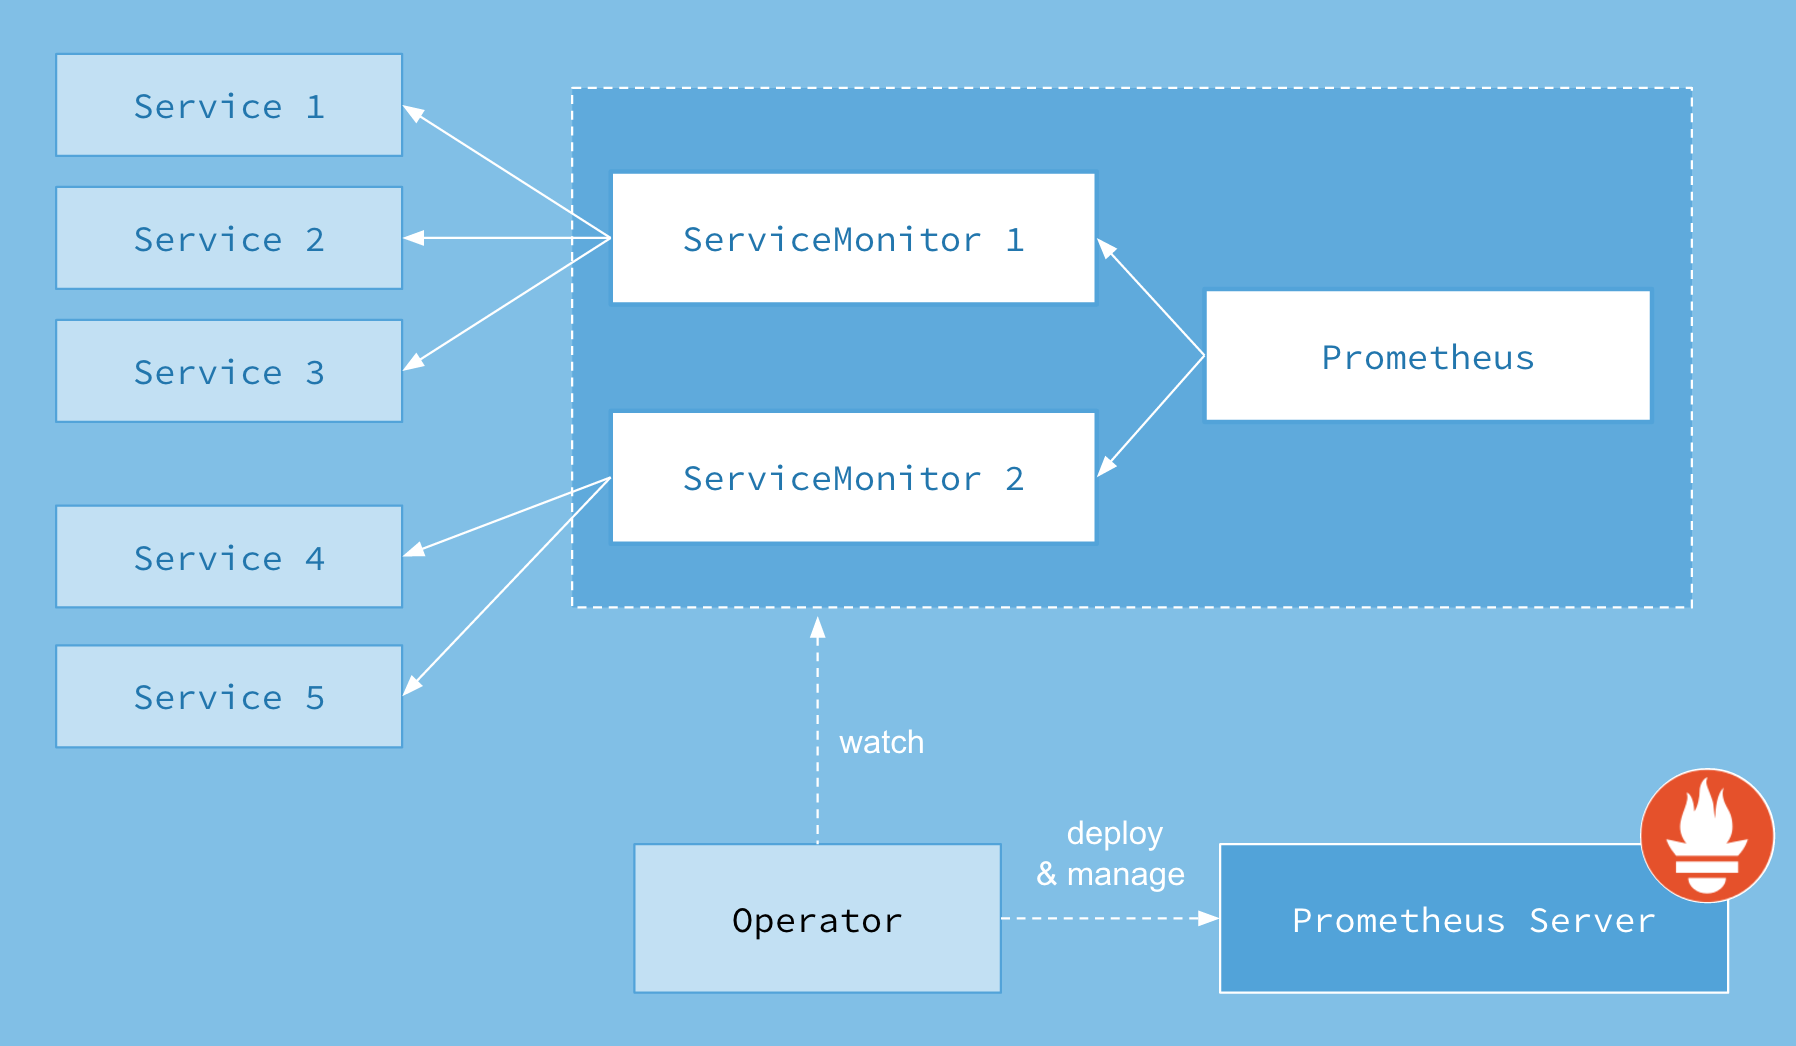
其中Operator是最核心的部分,作为一个控制器,他会去创建Prometheus、ServiceMonitor、AlertManager以及PrometheusRule4个CRD资源对象,然后会一直监控并维持这4个资源对象的状态
其中创建的prometheus这种资源对象就是作为Prometheus Server存在, 而serviceMonitor则是通过label来选择需要监控的一组service对象, prometheus也通过label来选择serviceMonitor
因此,每个业务线都是可以使用单独的prometheus server,这在海量监控数据下是推荐的用法,如果平台监控量不是很大也可以使用一个prometheus server, 然后serviceMonitor都关联该prometheus即可
部署
部署非常简单, 官方提供了一个yaml文件,只需要根据实际情况修改内容即可
1 | kubectl apply -f bundle.yaml |
使用
deployment/service
首先,需要一个deployment、service, 这里以最简单的nginx为例
1 | apiVersion: apps/v1 |
这两个资源对象没什么好说的
servicemonitor
接下来定义一个serviceMonitor
1 | apiVersion: monitoring.coreos.com/v1 |
这样通过servicemonitor就将service暴露了出来, 那又将如何将其加入到prometheus呢
prometheus
这里就需要定义一个prometheus对象,一个prometheus对象就是一个prometheus server
1 | apiVersion: monitoring.coreos.com/v1 |
这样创建之后就会生成一个statefulset的prometheus server的实例,同时动态生成scrape config
这里要说明的是, 如果是每个业务线单独使用prometheus, 则业务线自己去定义prometheus, 而如果是共用一个prometheus server,则可以事先将prometheus创建出来, 约定好servicemonitorselector所用的label, 然后要求所有业务线创建servicemonitor时使用这个label即可实现servicemonitor与prometheus自动关联
alertmanager
上面是实现了prometheus抓取nginx的metrics,那又如何实现报警规则的添加呢?
先创建出一个alertmanager 实例出来,名字叫example, 通过alertmanager-examples可以访问
1 | apiVersion: monitoring.coreos.com/v1 |
在传统的prometheus中都会在配置文件中指定alertmanager的地址, 同样, 使用operator的情况下也需要指定alertmanager,如下所示
1 | apiVersion: monitoring.coreos.com/v1 |
prometheusRule
上面prometheus只是关联了alertmanager,但是还没有一个具体的告警规则, 这就需要使用prometheusrule了
1 | apiVersion: monitoring.coreos.com/v1 |
可以发现它的labels与prometheus中指定的ruleSelector是相同的,prometheus也正是通过ruleSelector也关联prometheusRule规则,所以如果需要再不回几个告警,使用prometheus需要的label即可.
prometheus operator也支持直接对pod进行监控, 使用podMonitor,原理是一样的,不再细说
多副本
其实在上面的例子中, prometheus与alertmanager都可以使用多个副本部署, 实际上是以statefulset的形式运行
当指定prometheus replicas 大于1时,也就是说多个实例的configmwp文件是一样的,也就意味着多个实例需要抓取相同的配置,但是多个实例不一定会同时抓取,也就导致有某个时间点上数据不完全相同, 如何更好的解决prometheus高可用也官方的roadmap中
因此官方建议是使用服务分片的机制,可以按照业务区, 一个prometheus实例只管一个业务线, 当然如果有更高要加的场景下, 可以使用thanos架构来实现prometheus架构,不推荐使用prometheus的联邦方式
而对于alertmanager, operator在资源允许的情况下推荐replicas 大于1,alertmanager会以集群的方式运行,执行相同的配置,在prometheus产生的告警后,alertmanager实例之间会使用gossip协议来实现告警只触发一次, 避免告警在多个实例发送.
目前平台对告警数据的高可用并没有很大的需求,因此使用的是一个高配置的prometheus实例, 各业务线自己编写serviceMonitor及prometheusRule, 只需要包含特定的labels即可.