使用Prometheus监控consul提示415 Unsupported Media Type错误
虽然现业务架构上了kubernetes,因为历史遗留问题, 现在还存在着使用consul来做service discovery组件, 预计还得在生产中存在一段时间, 因此配上了Prometheus监控, 在部署过程中出现了一个Unsupported Media Type错
当然, 因为consul的3个节点都是二进制部署的, 因此在这里是直接使用了static discovery,很简单, 只需要在prometheus的配置文件中加入节点即可,consul官网也是很清楚的说明,参考这里
1 | - job_name: consul-k8s |
需要注意的是必须要指定format为Prometheus. 热启动Prometheus后,在Prometheus发现3个节点都是Down.
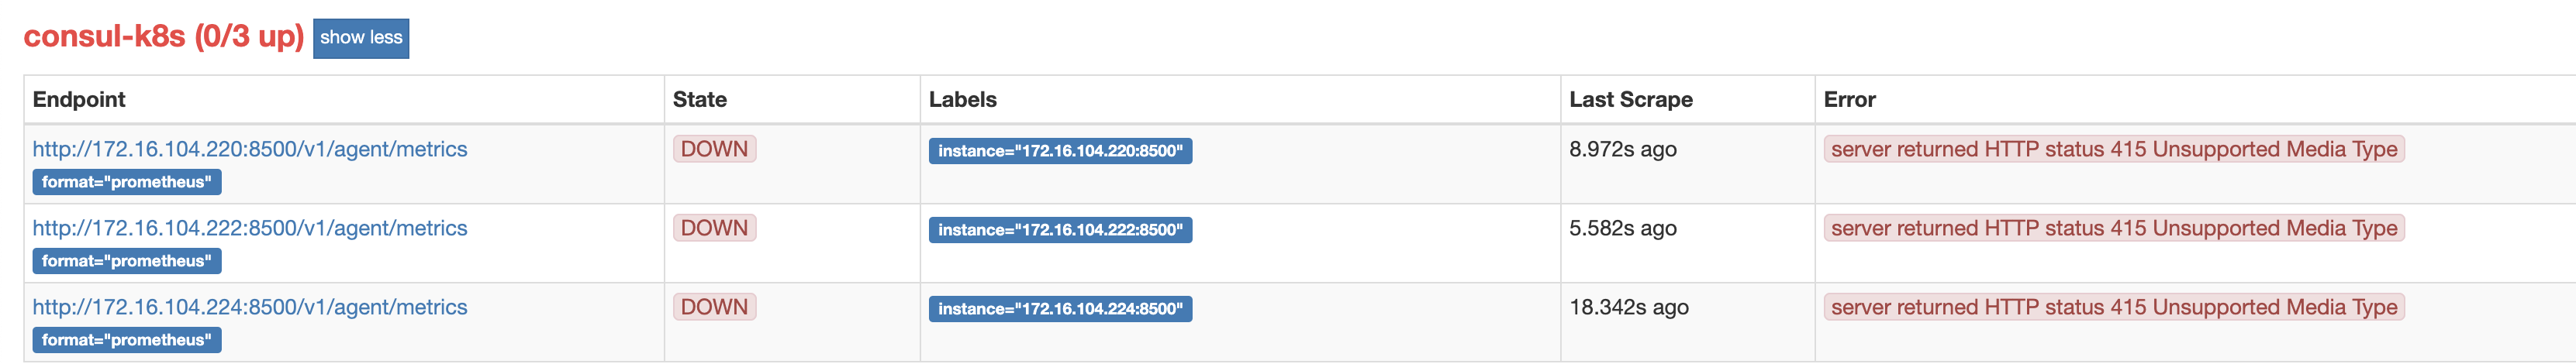
415 Unsupported Media Type, 直接翻译就是说, 返回的response是不支持的类型
登录一个consul节点使用以下命令查看是否有数据返回.
1 | curl 'localhost:8500/v1/agent/metrics?format=prometheus' |
结果:

这就很奇怪了, 从提示来看, 是因为 retention time
从consul的官网查看这个信息, 发现有个prometheus_retention_time配置, 该参数目前节点的配置是没有配置的
1 | prometheus_retention_time If the value is greater than 0s (the default), this enables Prometheus export of metrics. The duration can be expressed using the duration semantics and will aggregates all counters for the duration specified (it might have an impact on Consul's memory usage). A good value for this parameter is at least 2 times the interval of scrape of Prometheus, but you might also put a very high retention time such as a few days (for instance 744h to enable retention to 31 days). Fetching the metrics using prometheus can then be performed using the /v1/agent/metrics?format=prometheus endpoint. The format is compatible natively with prometheus. When running in this mode, it is recommended to also enable the option disable_hostname to avoid having prefixed metrics with hostname. Consul does not use the default Prometheus path, so Prometheus must be configured as follows. Note that using ?format=prometheus in the path won't work as ? will be escaped, so it must be specified as a parameter |
也就是说, 如果要用prometheus来监控consul, 则必须将这个值配置成大小0的值, 否则就会出现如上的错误
那这个值到底有何用呢, 从上面的解释来看, 这个参数指定了prometheus指标在内存中保存的时间, 如果不设置的话, 默认为0, 即不存在轮转时间, 上面还建议这个时间要是prometheus抓取的2倍, 当然这个时间越长, 使用的内存越多, 因此可酌情处理.
根据这个, 在consul原有配置文件的基础上加入以下配置, 然后再重启consul
1 | "telemetry": { |
注意: 在实践过程中发现使用consul reload命令重启consul发现配置不生效, 最好能够kill掉再启动, 或者systemd
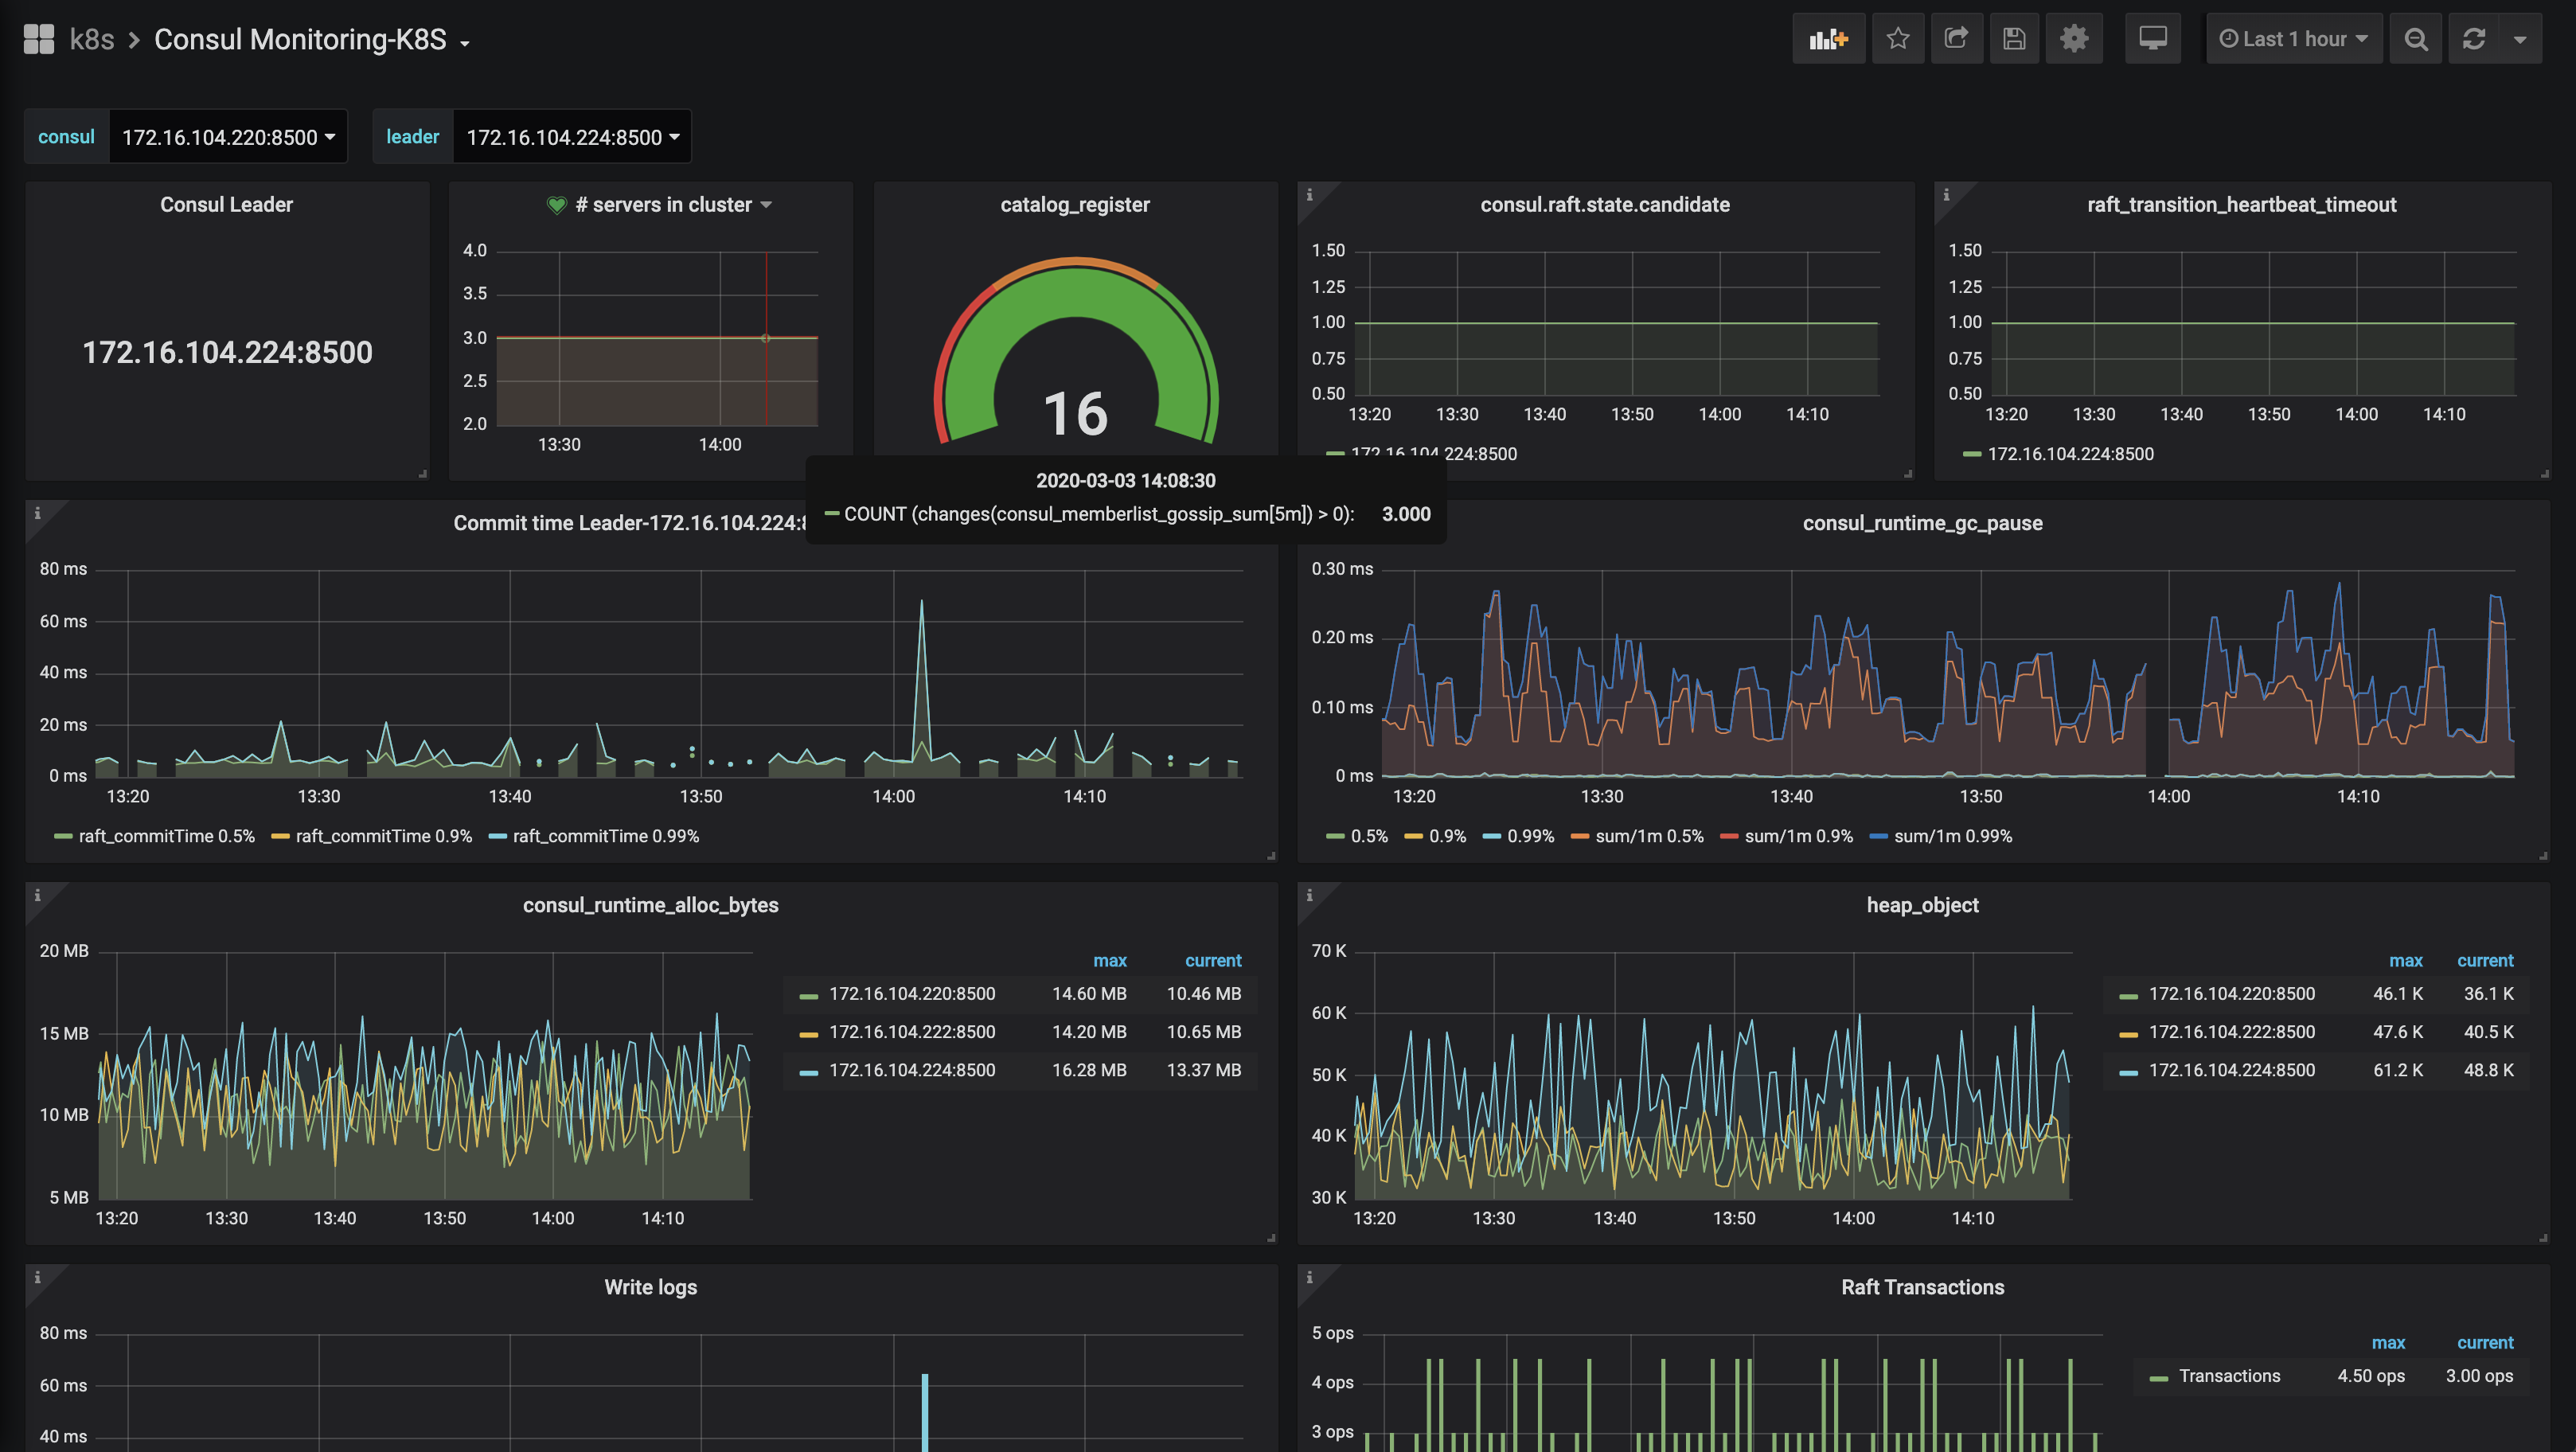
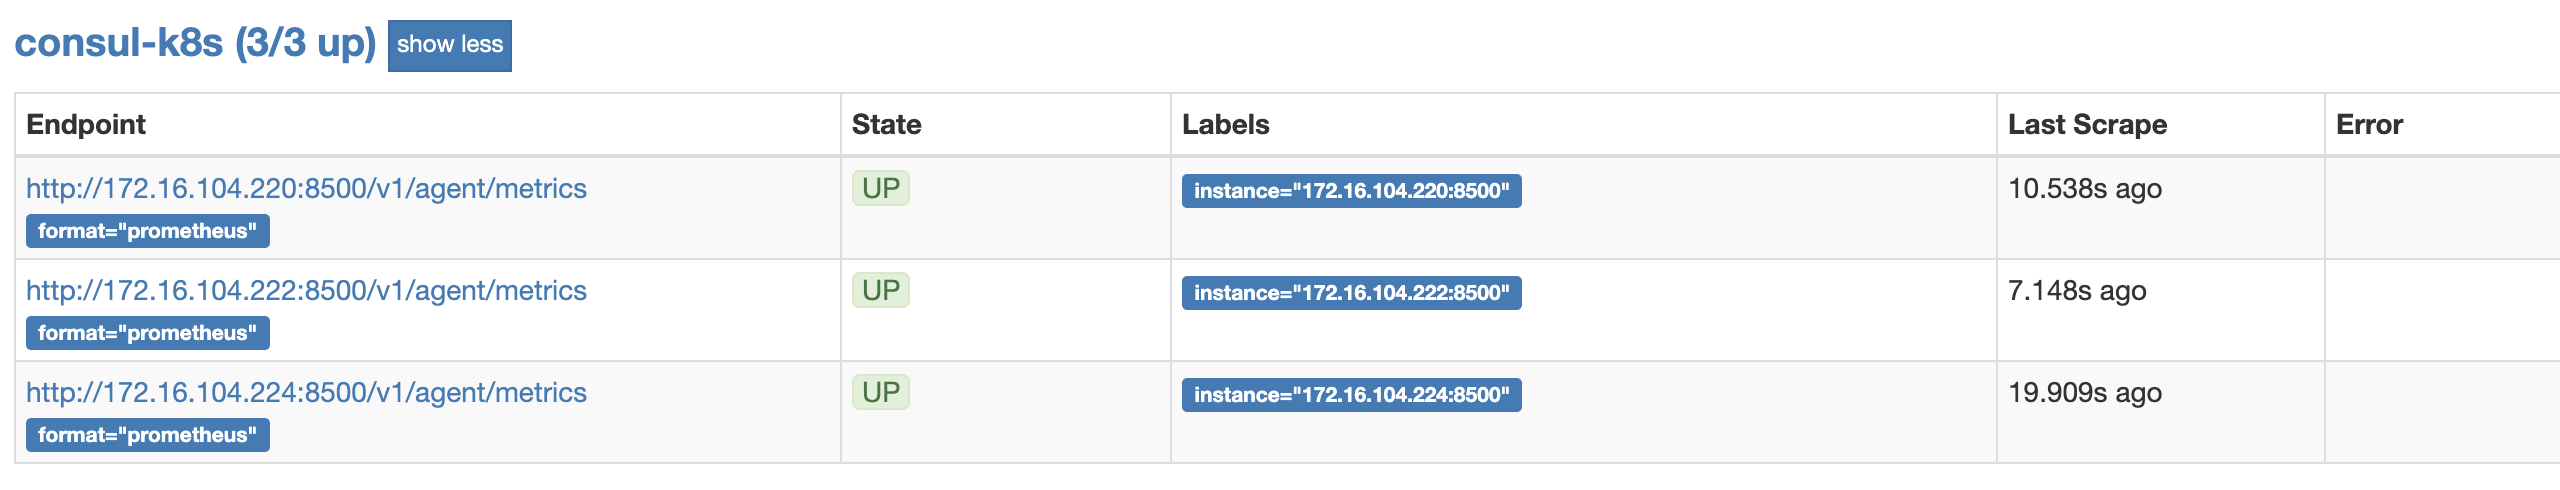
重启之后再看prometheus发现就正常了.
grafana上抓取的数据也正常了.